Filters
Filters are used to change the trace data in order to make it easier to analyse it, or to select just the information one wants to display. The filters developed up to date are one to group nodes, one to reuse the screen space of terminated threads, one to select the types of entities to be shown and one to summarize the use of a node. Each filter has an inspector, allowing the user to configure it. These inspectors are available in the  menu item. menu item.
Node Group
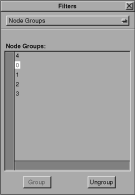
With this filter, one can make groups of nodes, that are treated as a unit by the other modules. To create a group, one selects nodes or groups to group (using click and shift-click), and then clicks on the "Group" button. Selected groups can be ungrouped using the "Ungroup" button.
Virtual Thread
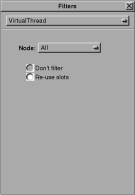 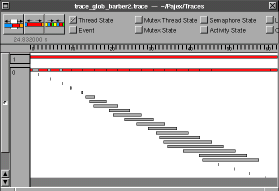
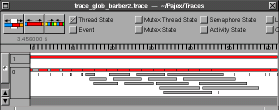
In this filter, one can select, for each node, if the slots of terminated threads will be reused (thus using less vertical space in the space-time diagram). The figure shows the same trace twice, without filtering and reusing the space of terminated threads.
By type Filter
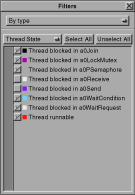
With this filter, one can select, for each kind of entity (events, thread states, communications, etc.), which types will be shown or not. The filter window also accepts ``drag-and-drop'' of colors from the color wheel (obtainable by "Tools/Colors..." in the main menu) to change the colors of all entities of a type.
Busy Node
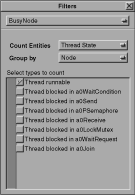
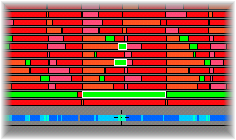
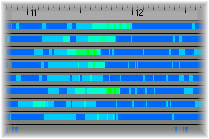
This filter summarizes entities of a certain kind in a new state-type entity called "Activity State", that represents the number of entities of the selected type coexist at each time slice. One typical use for this filter is to show the number of threads simultaneously in an active state in each node. This is an easy way to see the amount of parallelism inside a node. The relevant states are highlighted when the cursor is over the summary, as can be seen in the figure, where the cursor is over a light-green part of the summary, representing that there are three threads in a running state (the three green highlighted threads). This summary can be shown together with the normal thread display or by itself, to give a global vision of the state of all nodes (see second figure below).
 Pajé Home Page Pajé Home Page
|
